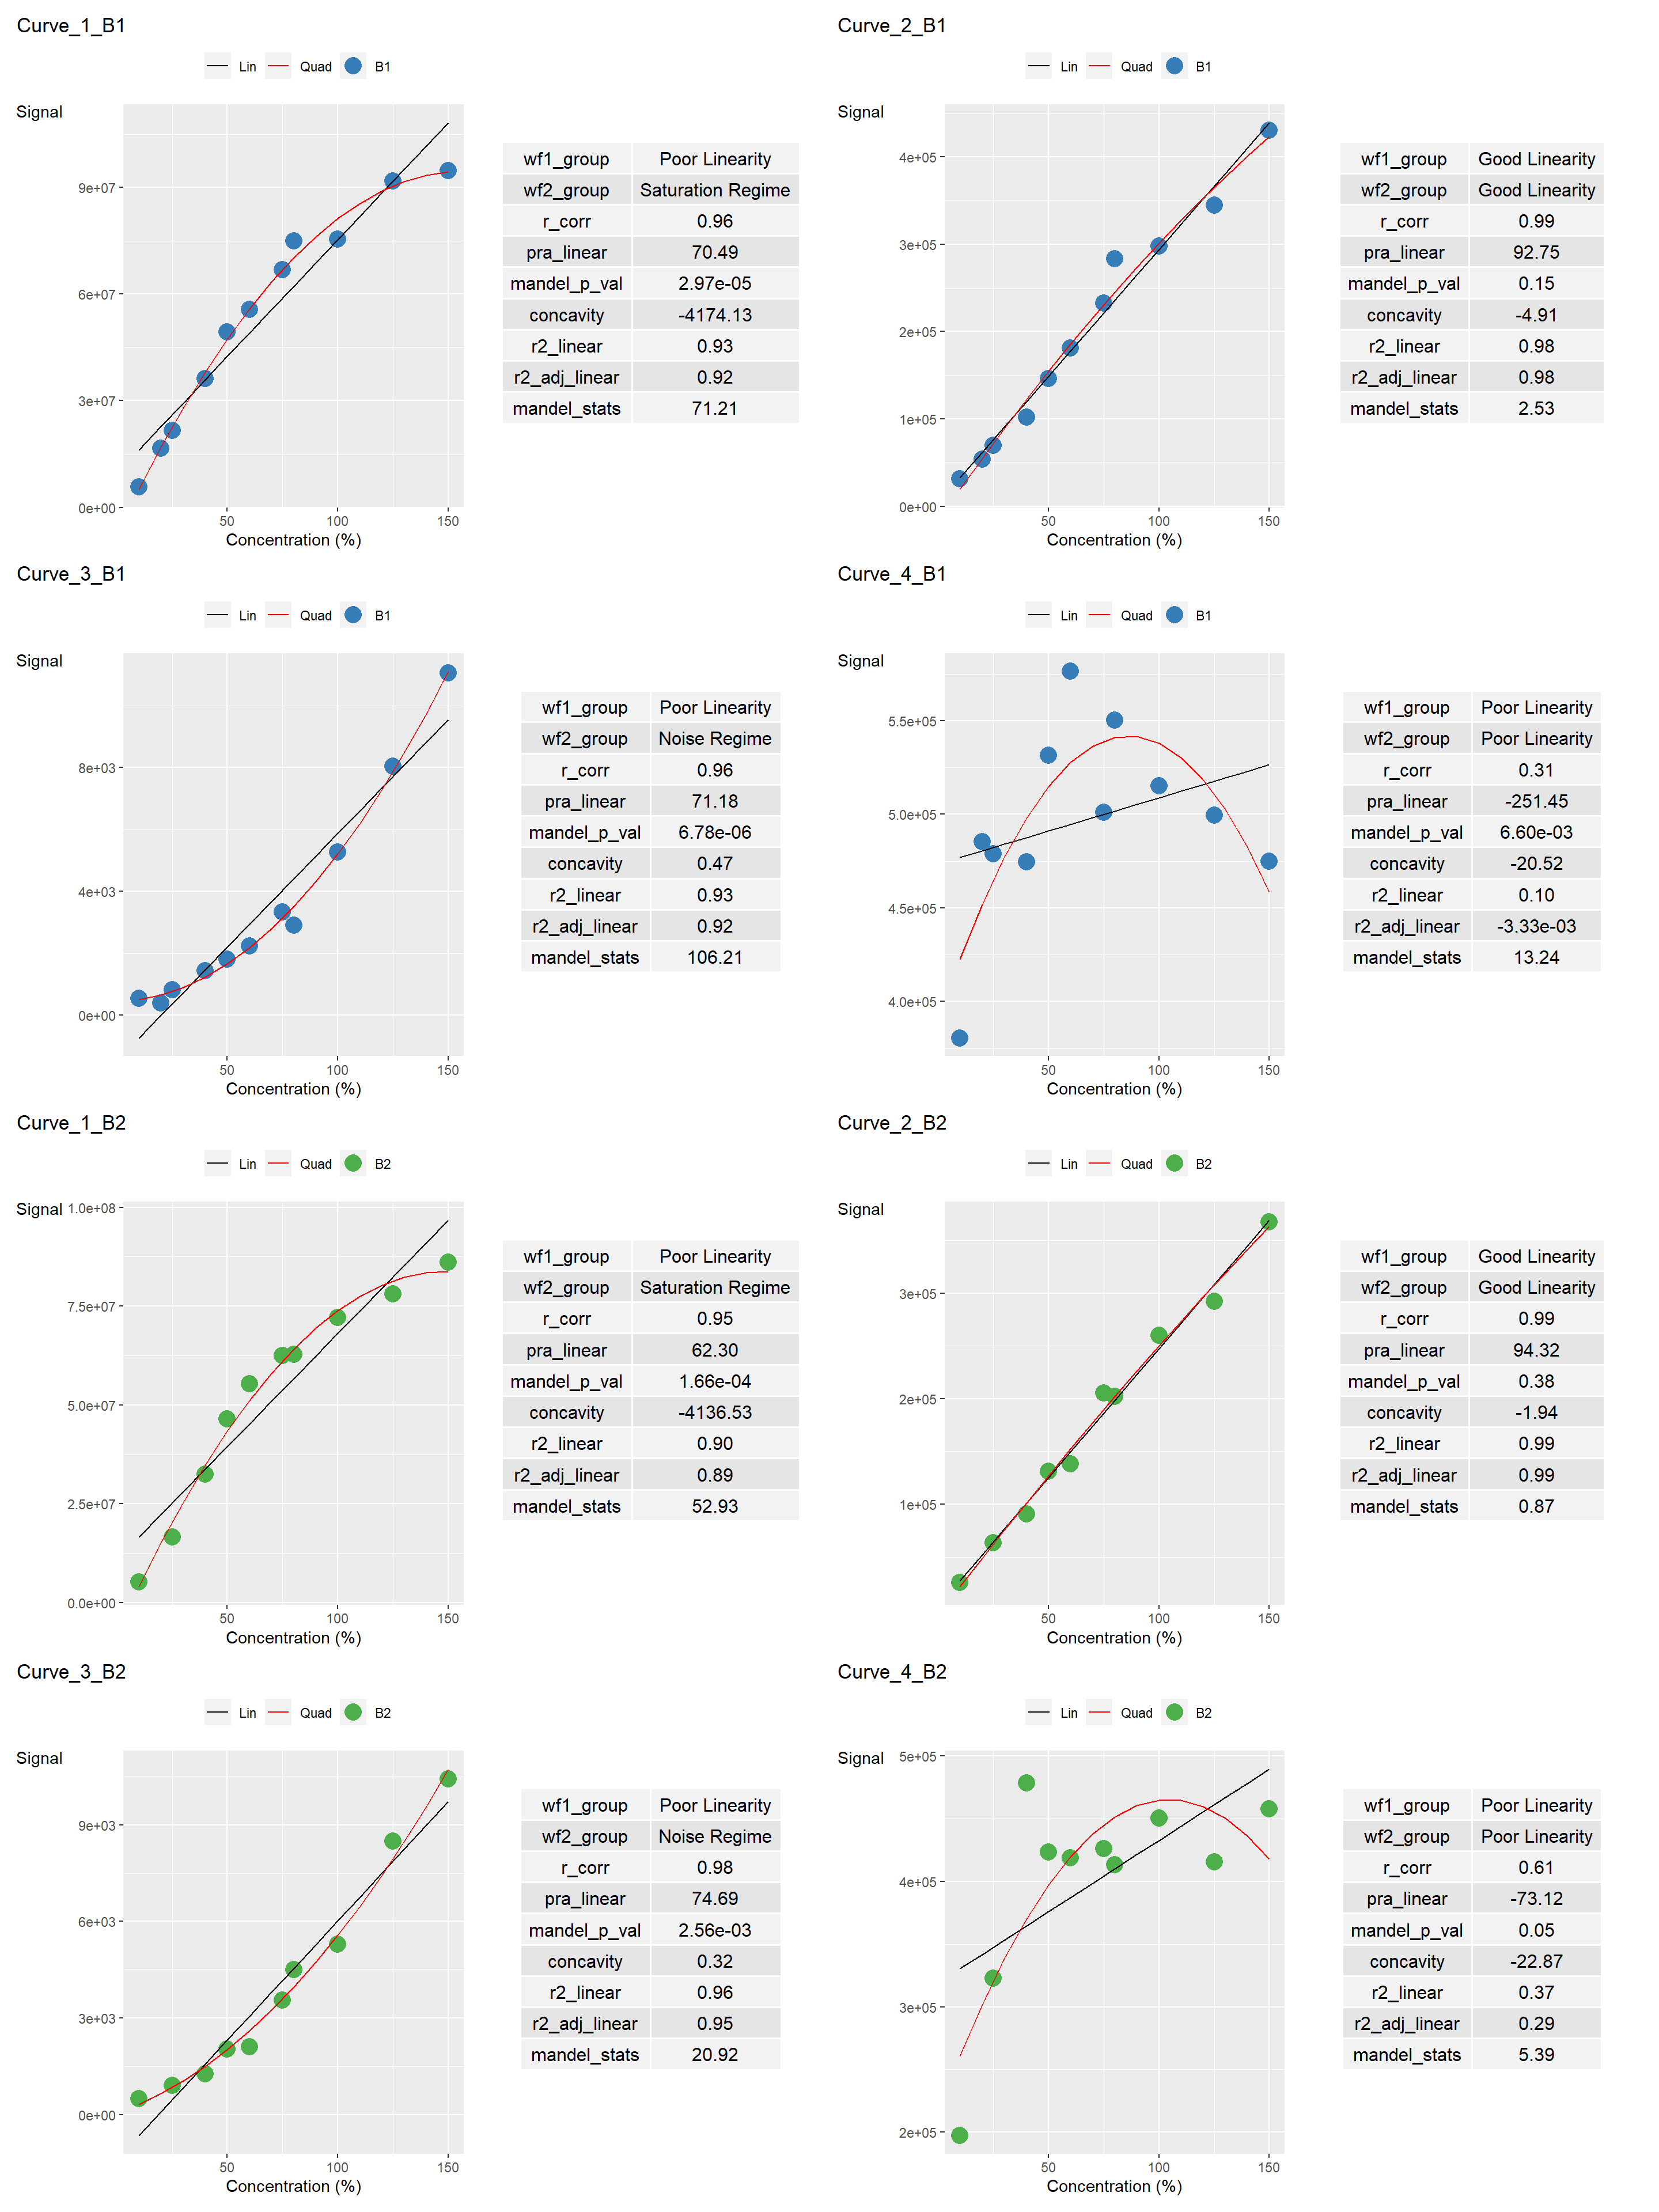
--- title: "`lancer` Example in Quarto" author: "Jeremy Selva" format: html: theme: light: cerulean dark: cyborg toc: true toc-depth: 3 toc-location: left number-sections: false code-fold: show code-overflow: scroll code-copy: true code-tools: true code-link: true self-contained: false smooth-scroll: true --- # R Packages used ```{r R Packages used} library (lancer)library (tibble)library (reactable)library (patchwork)library (sessioninfo)library (report)``` ```{r See packages info} #| code-fold: true <- sessioninfo:: package_info ()rownames (r_package_table) <- NULL |> :: mutate (version = ifelse (is.na (r_package_table$ loadedversion), $ ondiskversion, $ loadedversion)|> :: filter (.data$ attached == TRUE ) |> :: select (c ("package" , "version" , "date" , "source" |> :: reactable (columns = list (package = reactable:: colDef (# Freeze first column sticky = "left" ,style = list (borderRight = "1px solid #eee" ),headerStyle = list (borderRight = "1px solid #eee" ))``` # R Platform Information ```{r See session info} #| code-fold: true # Taken from https://github.com/r-lib/sessioninfo/issues/75 <- function () {if (isNamespaceLoaded ("quarto" )) {<- quarto:: quarto_path ()<- system ("quarto -V" , intern = TRUE )if (is.null (path)) {"NA (via quarto)" else {paste0 (ver, " @ " , path, "/ (via quarto)" )else {<- Sys.which ("quarto" )if (path == "" ) {"NA" else {<- system ("quarto -V" , intern = TRUE )paste0 (ver, " @ " , path)<- sessioninfo:: platform_info ()"quarto" ]] <- get_quarto_version ()[1 ]<- data.frame (setting = names (r_platform_table),value = unlist (r_platform_table,use.names = FALSE ),stringsAsFactors = FALSE |> :: reactable (defaultPageSize = 5 ``` # Data creation ```{r Data creation} <- c (10 , 20 , 25 , 40 , 50 , 60 ,75 , 80 , 100 , 125 , 150 ,10 , 25 , 40 , 50 , 60 ,75 , 80 , 100 , 125 , 150 )<- c ("B1" , "B1" , "B1" , "B1" , "B1" ,"B1" , "B1" , "B1" , "B1" , "B1" , "B1" ,"B2" , "B2" , "B2" , "B2" , "B2" ,"B2" , "B2" , "B2" , "B2" , "B2" )<- c ("Sample_010a" , "Sample_020a" , "Sample_025a" ,"Sample_040a" , "Sample_050a" , "Sample_060a" ,"Sample_075a" , "Sample_080a" , "Sample_100a" ,"Sample_125a" , "Sample_150a" ,"Sample_010b" , "Sample_025b" ,"Sample_040b" , "Sample_050b" , "Sample_060b" ,"Sample_075b" , "Sample_080b" , "Sample_100b" ,"Sample_125b" , "Sample_150b" )<- c (5748124 , 16616414 , 21702718 , 36191617 ,49324541 , 55618266 , 66947588 , 74964771 ,75438063 , 91770737 , 94692060 ,5192648 , 16594991 , 32507833 , 46499896 ,55388856 , 62505210 , 62778078 , 72158161 ,78044338 , 86158414 )<- c (31538 , 53709 , 69990 , 101977 , 146436 , 180960 ,232881 , 283780 , 298289 , 344519 , 430432 ,25463 , 63387 , 90624 , 131274 , 138069 ,205353 , 202407 , 260205 , 292257 , 367924 )<- c (544 , 397 , 829 , 1437 , 1808 , 2231 ,3343 , 2915 , 5268 , 8031 , 11045 ,500 , 903 , 1267 , 2031 , 2100 ,3563 , 4500 , 5300 , 8500 , 10430 )<- c (380519 , 485372 , 478770 , 474467 , 531640 , 576301 ,501068 , 550201 , 515110 , 499543 , 474745 ,197417 , 322846 , 478398 , 423174 , 418577 ,426089 , 413292 , 450190 , 415309 , 457618 )<- tibble:: tibble (Sample_Name = sample_name,Curve_Batch_Name = curve_batch_name,Concentration = concentration<- tibble:: tibble (Sample_Name = sample_name,` Curve_1 ` = curve_1_saturation_regime,` Curve_2 ` = curve_2_good_linearity,` Curve_3 ` = curve_3_noise_regime,` Curve_4 ` = curve_4_poor_linearity``` ```{r View curve_batch_annot} |> :: reactable (defaultPageSize = 5 ,bordered = TRUE ,highlight = TRUE ,paginationType = "jump" ``` ```{r View curve_data} |> :: reactable (defaultPageSize = 5 ,bordered = TRUE ,highlight = TRUE ,paginationType = "jump" ``` # Create curve table ```{r Create curve_table} <- lancer:: create_curve_table (common_column = "Sample_Name" ,signal_var = "Signal" ,column_group = "Curve_Name" ``` ```{r View curve_table} |> :: reactable (defaultPageSize = 5 ,defaultColDef = reactable:: colDef (minWidth = 200 ),bordered = TRUE ,highlight = TRUE ,paginationType = "jump" ``` # Create curve statistical summary ```{r Create curve statistical summary} <- lancer:: summarise_curve_table (grouping_variable = c ("Curve_Name" ,"Curve_Batch_Name" ),conc_var = "Concentration" ,signal_var = "Signal" )<- lancer:: evaluate_linearity (grouping_variable = c ("Curve_Name" ,"Curve_Batch_Name" ))``` ```{r View curve_summary} |> :: reactable (defaultPageSize = 5 ,defaultColDef = reactable:: colDef (minWidth = 200 ), bordered = TRUE ,highlight = TRUE ,paginationType = "jump" ``` ```{r View curve_classified} |> :: reactable (defaultPageSize = 5 ,defaultColDef = reactable:: colDef (minWidth = 200 ),bordered = TRUE ,highlight = TRUE ,paginationType = "jump" ``` # Export results as Excel ```{r Export results as Excel} :: write_summary_excel (file_name = "curve_summary.xlsx" )``` # Export results as pdf ```{r Export results as pdf} <- lancer:: add_ggplot_panel (curve_summary = curve_classified,grouping_variable = c ("Curve_Name" ,"Curve_Batch_Name" ),conc_var = "Concentration" ,signal_var = "Signal" )# Get the list of ggplot list for each group <- ggplot_table$ panel:: view_ggplot_pdf (filename = "curve_plot.pdf" ,ncol_per_page = 2 ,nrow_per_page = 2 )``` ```{r View ggplot_list} #| fig-width: 15 #| fig-height: 20 #| fig-alt: "A display of dilution curves with summary statistics in ggplot." #| column: screen-inset-right :: wrap_plots (ncol = 2 ,nrow = 4 ``` # Export results as trellis table ```{r Export results as trellis table} #| column: screen-inset-right <- lancer:: add_plotly_panel (curve_summary = curve_classified,grouping_variable = c ("Curve_Name" ,"Curve_Batch_Name" ),sample_name_var = "Sample_Name" ,curve_batch_var = "Curve_Batch_Name" ,curve_batch_col = c ("#377eb8" ,"#4daf4a" ),conc_var = "Concentration" ,conc_var_units = "%" ,conc_var_interval = 50 ,signal_var = "Signal" ,have_plot_title = FALSE )<- lancer:: convert_to_cog (grouping_variable = c ("Curve_Name" ,"Curve_Batch_Name" ),panel_variable = "panel" ,col_name_vec = "col_name_vec" ,desc_vec = "desc_vec" ,type_vec = "type_vec" # Pressing Render button will not create the # index.html file (Though it is not needed) # Call this function via console to create index.html file :: view_trellis_html (grouping_variable = c ("Curve_Name" ,"Curve_Batch_Name" ),trellis_report_name = "Curve_Plot" ,trellis_report_folder = "Curve_Plot_Folder" )``` # R Package Reference ```{r package references} #| code-fold: true #| output: asis :: cite_packages () |> suppressWarnings ()```